Mission-driven organizations are awash in data: surveys, assessments, student information systems, CRMs, public datasets, and spreadsheets that each report a little differently. Teams chase metrics for funders, reconcile numbers across sources, and burn out analysts on a hamster wheel of QC and caveats.
We help organizations lead from their data instead of wrestling with it. We align sources, automate the routine work, and put clear, actionable findings in the hands of the people closest to the work, so improvement can happen at every level.
We usually build in what your team already uses, from Google Sheets and Apps Script to PostgreSQL, Airtable, and your survey platform, so the system keeps working after we leave.
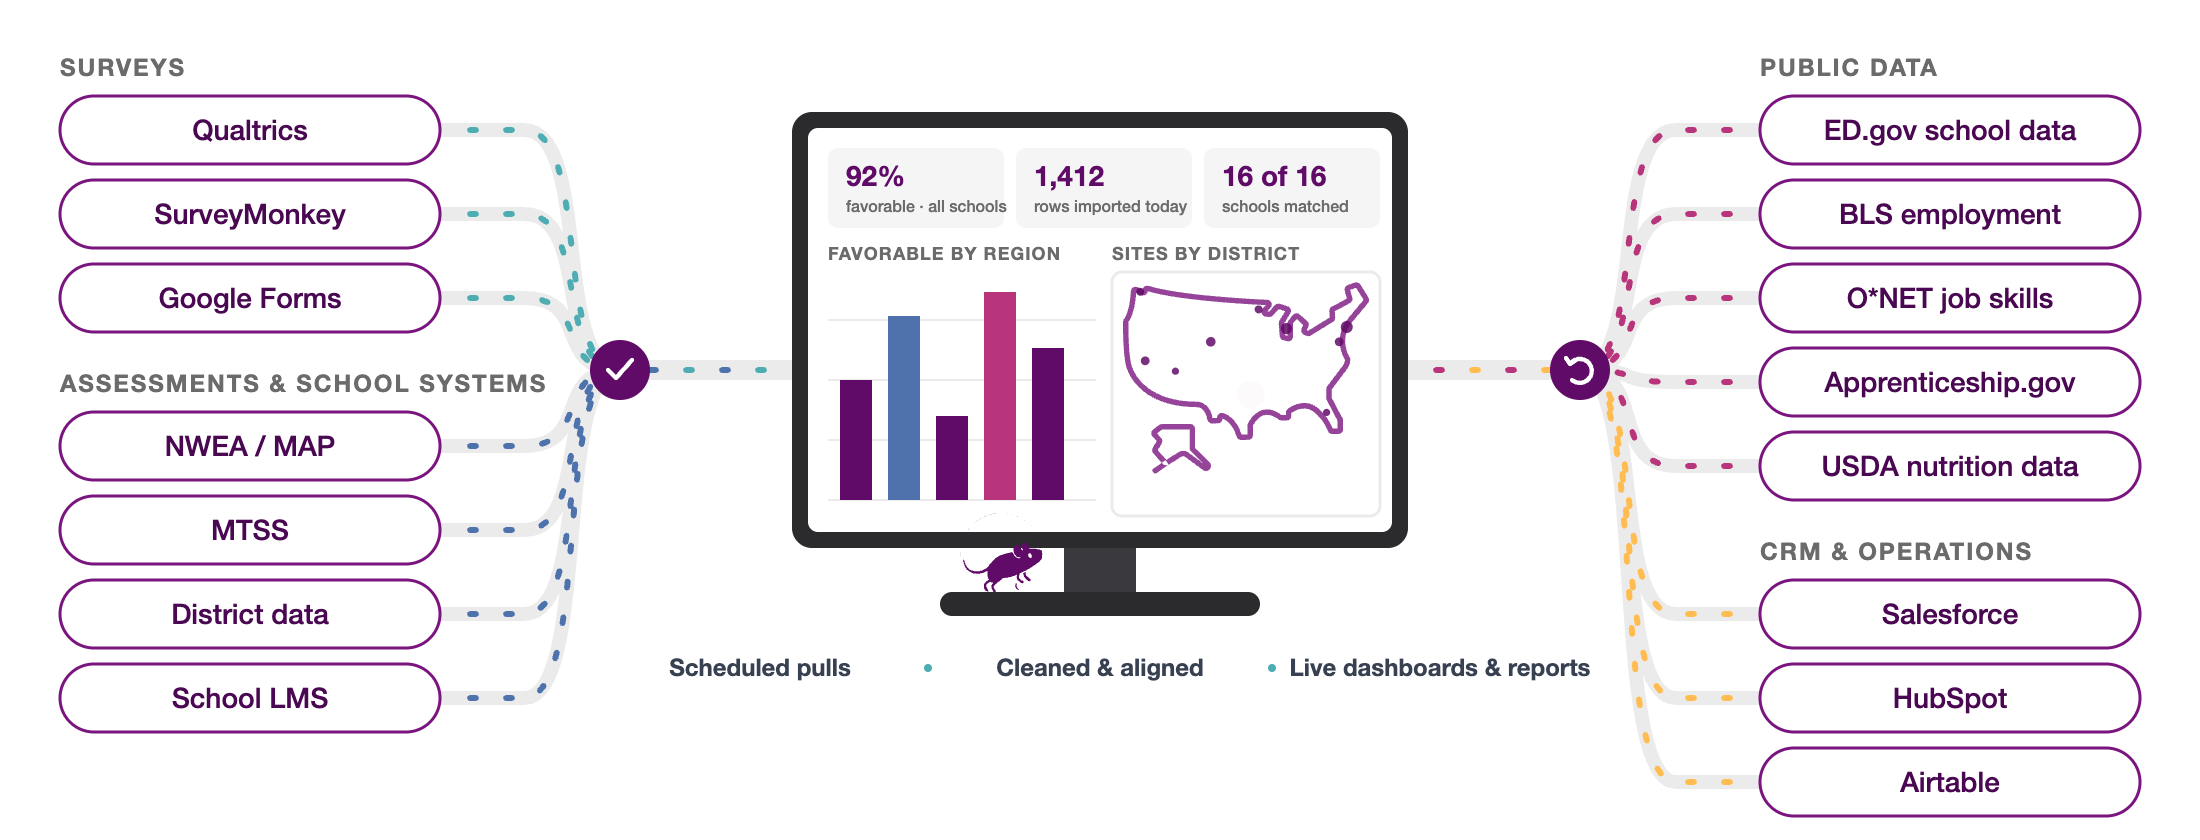
Typical work includes
- Dashboards and reporting, with permissions scoped from the network office to the school or site
- Data pipelines and automation: scheduled feeds from vendors, SFTP drops, CRMs, and forms
- Data quality and QC: validation, reconciliation, fuzzy matching, and de-identification
- Analysis and insight that joins public data with your own
- Survey design and measurement: instrument design, construct validation, norm-referenced reporting
- Responsible AI and automation inside your environment, so your data never leaves it
How this connects
Data work rarely ends at the dashboard. The same findings usually need to reach a board, a funder, or a classroom, and the systems that hold the data are often the platforms we help teams select.
Go deeper
Our data services site walks through three recent builds, with short video tours: a network-wide survey and assessment dashboard, an automated weekly assessment tracker, and a live advising dashboard.
Explore the data services siteHave a report you dread producing?
Tell us what you are trying to learn from your data. We will tell you how we would automate it, and what your team could do with the time.